Top 5 reasons to use Microsoft Power BI

Top 5 reasons to use Microsoft Power BI are as follows.
There are several factors which makes a Power BI a very smart tool to use for Data Analyses purpose, but we will focus on top 5 reasons to use Microsoft Power BI. These factors give the Power BI user a competitive edge over the typical Business Intelligence methodology user.
Power BI is easy to learn
Power BI is fairly easy to learn as compared to Excel which was being used in Business Intelligence primarily. In Excel user have to remember formulas to perform fast queries which can be very long at some times. But in Power BI, the user can simply use GUI methods to solve most of the problems. It is a beginner-friendly tool that does not need a lot of prior experience to start with. In fact, it is the best tool to get started in Business Intelligence and Data Analysis.
A beginner can simply start by the drag and drop method in Power BI. User will have different charts and plots which are available with just one click. No need to know to code. Importing data is also fairly easy in Power BI.
Read about the Microsoft Power BI
Power BI Visualization
Power BI has very easy to use visualization tools. That can be easily implemented in a report or dashboard. Power BI visualization tool include-
- Bar chart
- Column chart
- Line Chart
- Area chart
- Ribbon chart
- Scatter chart
- Pie chart
- Doughnut chart
- Treemap
- Map
- Gauze
- Table
- Matrix
- KPI and several others
Apart from these usual charts, Power BI also allows you to use your own charts if you know to code in Python or R programming language. Power BI gives you a direct option to integrate Python or R visual with a simple click.
But if you don’t know to code still, then you have lots of different options to play with. You can simply import charts from any file that is currently available to you. After importing once, that chart will be available for you for future use.
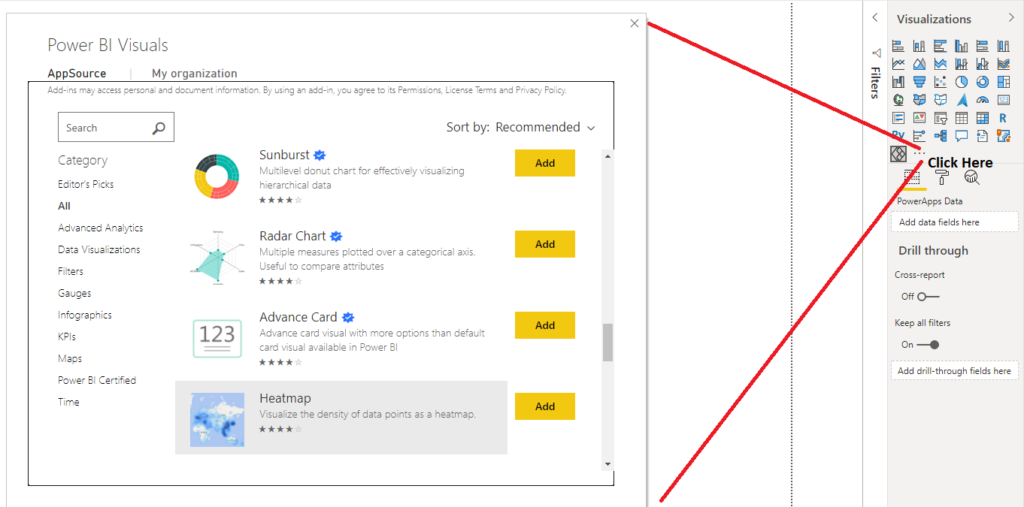
Power BI also gives you the option to use prebuilt charts by someone else. These charts can be simply used by simply clicking a button as shown in the below picture
If you do not want to use any of the visualizations available and want to create your own. Power BI gives you that option as well. You can use Power BI Custom Visual Tool to design your own visualization. This tool uses CSS, JavaScript and NodeJS. You can also use Office Store official site to download new visualization. So Power BI has a lot of options to use when it comes to visualization.
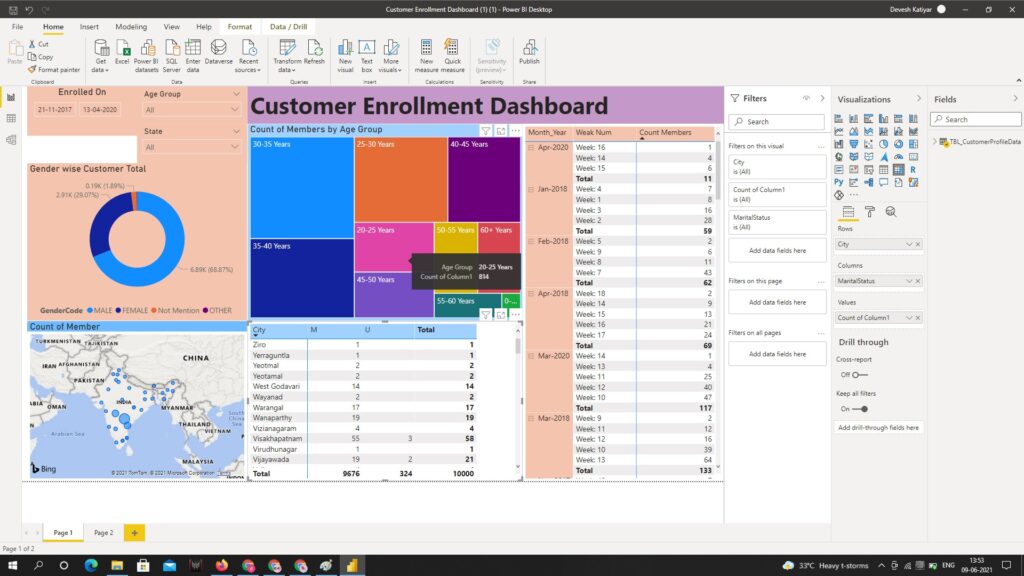
Power BI Storytelling
Power BI is not just about charts, but it is about storytelling. User can easily make observations related to a given problem by using Power BI. Later, on the basis of those observations user can derive charts that are related to the problem. User can make a timeline of such charts to show the performance of any product with respect to time. User can also make a comparative study of a factor in comparison to several other factors. One can also derive conclusions and notice the minor details and factors that might remain hidden in Excel.
Also, Power BI is an interactive way to present information to the user. This information can further be delivered to other organizations’ member through screen sharing, or during a presentation, in PDF format, or by simply sharing the Power BI file to the registered users. Power BI can also be accessed by mobile devices, which gives you the power to check your business performance while being outside the office. You do not need to call for a meeting to check performance like last month’s sales, last month’s expenditure e.t.c.
Reports and Dashboards are two important types of storytelling. The report is a multiple page setup considering more information and details about a problem or business scenario. The dashboard is more like a fast approach to gain maximum information in a flash of sight.
Power BI uses servers to manage your dashboards in real-time. That means you can watch the reports in real-time and also can notice the changes compared to the last performing day. This gives an edge over your competitors in business.
Power BI NLP
This is one of the most interesting features of Power BI. Power BI NLP lets you ask the query in natural language and performs the required operation on the basis of the query you entered. You can ask a simple question in the English language and power bi will perform all the operation including visualization to show you the final chart on your query.
Example- What was the profit for last month?
Power BI will take in this query and come up with a chart as an end result to show the profit of your mast month data. As you will be typing in the query Power BI will suggest terms on the basis of your tables. One thing that should be considered here is if you have more than one table, then make sure that all the table are connected to each other with schemas. So that you can fetch the data from the other table for maximum accuracy of your report or dashboard. You should also check for the data type of various columns. Make sure all the connected columns in the different table have the same data type.
Power BI Integrations
This feature of Power BI makes it very popular and easy to rely on. Power BI can be integrated with any of the service, task, technology of any app, service or database. Power BI is very robust in handling data from any ongoing technology means that you do not have to change any framework or technology you are currently working on or worry about any kind of prerequisites.
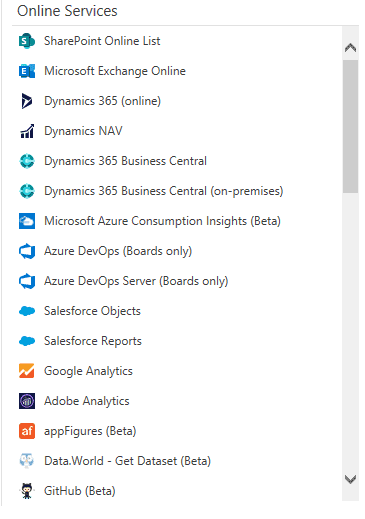
If you are working on an SQL database or Excel file or a CSV file or any Cloud Service, you can just pull the data in a minute. It’s that easy with Power BI. You can also integrate with services from Google Analytics, Adobe Marketing Cloud, SAP HANA, Salesforce, accounting with Xero or building business process with K2 Cloud, you can simply use Power BI in those services as well as anything you can really think of.
These were the Top 5 reasons to use Microsoft Power BI according to me. However, there are several other factors to choose Power BI.
Different Power BI Products
Power BI Service
Power BI service is not a product in itself, but it comes with every other product as a necessary part of it. It is a Microsoft hosted Cloud service that helps in sharing the report with other users. It can be used by other users to share their reports online and monitor them in real-time also. Such reports are important for a business that needs a regular inspection of its performance.
Power BI Desktop
Power BI Desktop is a free product from Power BI. It can be downloaded into the user’s computer system and can be used as a Data analysis or Business Intelligence tool on a Windows system. It helps you to pull data from hundreds of services including Salesforce, Azure SQL DB, Dynamic 365, It helps you to gain insights from the data retrieved.
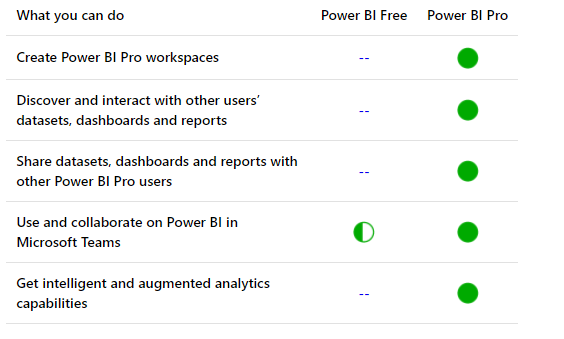
Power BI Pro
This product lets you explore the data really easily by the use of NLP as discussed earlier. You can simply ask a question and will get a plotted chart on the basis of your question. Questions you will ask need not be in technical language, you can simply use your own words. It gives you a prebuilt data visualization template as well to build your report quickly. You can also share your work with your teammates using Microsoft Teams. It also safeguards your data.
Microsoft Power BI Pro costs around £7.50 per user/month or around $10 per user/month. You can buy Power BI Pro by simply clicking here.
Power BI Premium
This is not an application like Power BI pro and Power BI desktop. Power BI premium comes for organization that need to collaborate on projects. Power BI premium gives faster decision-making as the whole team or organization can simultaneously access the ongoing report and provide their valuable input from time to time. Premium comes with on-demand scaling feature which let you grow your team as per requirement without worrying about lack of access.
Power BI Premium also comes with Power BI Report Server which let you handle all your resources in one place. Premium version can help you share information inside as well as outside the organization. Premium charges are as per computer cores you will use. Power BI premium pricing page can be seen here.
Premium version let you clear the data once and use it “n” time in numerous models. It works perfect with larger data sizes and gives you the power of Big Data with the help of Power Query. It lets you use other Microsoft services with ease like Azure Cognitive Services, impact analysis and techniques like AutoML, dataflows, application lifecycle management.
Power BI Mobile
Power BI mobile is basically used to monitor the reports or dashboard. These reports are made by Power BI Desktop or Power BI Pro. Once made, these reports or dashboards can be accessed by any user anywhere in the world. You can also share and collaborate with your team to share insights about your business. You can also ask NLP questions to check for better insights.
Power BI Report Server
Power BI Server is an on-premises server that lets you access the reports developed by someone else by using Power BI Desktop or Power BI Pro. These developed reports can be published on Report Server which can be accessed by any of the above media.
Power BI Embedded
Power BI Embedded is used in applications but developers. It comes with lots of APIs and SDKs that let the developer focus on their application rather than focusing on reports or dashboards. If required, reports can be made really easily with the help of pre-built reports and NLP.
Embedded ensures row-level security so that the user can only see the data that he is allowed to and nothing else. Embedded service can be used in the following way. First, make a report on the Power BI desktop. Second, publish the report and test with APIs and SDKs. Now embed your report with Power BI Embedded.
2 thoughts on “Top 5 reasons to use Microsoft Power BI”