Data Analysis: Overview, Roles and Responsibilities

Data Analysis Overview and the whole process of storytelling
Before starting the storytelling, we need to learn the small factors about the Data Analysis. These factors might be small but very crucial when it comes to storytelling. One should know about these factors because they affect the performance and learning of the person both directly and indirectly. These factors are Types of Analytics, Different roles in Data and their expertise, Role of Data Analyst. We will cover these topics in this tutorial as this will further sharpen your skills and help you understand thing better.
According to Microsoft, “Data Analysis is the process of identifying, cleaning, transforming, and modelling data to discover meaningful insights”. Then this data can be crafted in a story with the help of dashboards and reports.
With the increase in the number of users of the internet and most of the business moving online, the amount of data has increased exponentially. This data is now used to help businesses in setting goals and drawing conclusions. An increase in data-centric businesses also increased the demand for data professionals. Hence, we are seeing more Data roles. Let’s look at these different roles one by one.
Read more: Top 5 reasons to use Power BI
Different roles in Data
In the past, there were only a few roles related to data. As there was lesser data available, so fewer people were needed to manage and the field itself was small. But today the amount of data is vast, and it will grow even more in the near future because of new internet users and most of the activities moving online, including business. Hence, this will create a situation where every company irrespective of business type, country of origin of the company, irrespective of company size will need people to analyse their data to boost their business and grow revenue.
- Data Analyst
- Data Engineer
- Business Analyst
- Data Scientist
- Database Administrator
Data Analyst
Data Analysts roles including preparing, cleaning, transforming data. Then using that transformed data to make scalable models and Analysis of that data through advanced analytical skills. In short, a Data Analyst maximized the value of data and help business (or organizations) to make a decision on the basis of that data. Data Analyst helps a stakeholder to identify important and meaningful data out of the raw data and then use that data to generate meaningful insights which can be easily made and can be conveyed through a medium.
Such a tool to make meaningful reports and dashboard is Power BI. A data analyst is responsible for managing the datasets, dashboards, reports and workspaces. Their task is to maintain and configure proper security procedures so that the data does not slip into someone else’s hand.
Data Analyst work with a Data engineer to determine the appropriate data source for a business problem. They also work with Data Administrator so that they can have proper access to the data required. Sometimes they also suggest Data Administrators for better data sources to get better results.
Data Engineers
Data Engineers are responsible for storing data and managing data flow for an on-premises or cloud-based business. They perform these tasks with the help of data platform technologies. They are responsible for developing and maintaining the storing architecture of the data. Furthermore, they also manage and secure the flow of data between different functionalities. Data Engineers design, construct, install, test and maintain a highly scalable DBMS. The data platforms might include file stores, data streams, relational database, non-relational database.
The primary objective of Data Engineers is to collaborate with the business stakeholders and use various tools to collect required data from different sources. However, the Data Engineers role is beyond just managing the database, Data Engineers also do Data wrangling to collect important data for the problem. These techniques reduce the time for a Data scientist to improve the quality of the data and make it business-ready. Data Engineer focuses to collect data only from those sources which are currently under problems prescriptive. However, Data scientist also performs data wrangling at their end to further improve the quality of data.
Data Engineer brings a lot to the table from Business Intelligence’s perspective. The Data Analyst works closely with the Data Engineer to make sure that they have a lot of structured and unstructured data, which will further support in optimizing the model.
Business Analyst
Most of the roles of a Business Analyst overlaps with the Data Analyst itself. In some organizations, we see the same person working in both roles. So, this role is very close to data analyst with only one change. Business Analyst is more business directed, i.e. they are more interested in how can they use that data to grow profit or revenue of the business.
Data Scientist
This is considered one of the coolest job right now. Data scientists are those who are more interested in extracting value from the data. They apply advanced analytics techniques and their role might vary from descriptive analytics to predictive analytics. Descriptive analytics is defined as evaluating the data by the process of Exploratory Data Analysis (EDA). Predictive analytics is about applying forecast models on the data that can detect patterns in the data. Machine learning and Deep learning come into play when it is about forecast and detecting anomalies.
Sometimes, Data Scientist might be using a customized algorithm to solve their problem. As we know Data Scientists, spend most of their time in data wrangling and Feature Engineering. Modelling takes very little time in comparison to these important steps. Data Scientists can speed up their work if Data Engineers perform good Data wrangling techniques, However, still, then the need for data wrangling remains as Data scientists need to figure out important features and unimportant features from the dataset.
Data Analysts also work with Data Scientists to make reports and visualizations that also helps them with time and help them understand better the problem they are currently solving.
Database Administrator
Database Admin is responsible for the availability and performance of the database. They are also responsible for optimizing the database. They implement different tools and process for data recovery in the case of a data plan. They also perform data backup techniques from time to time. The Database Administrator is responsible for the overall security of the data and database. They restrict user access to the data and provide privileges to the data as per the need and requirements. Data Admin monitors the health of the data and its security.
Types of Data Analysis
- Descriptive Analytics
- Predictive Analytics
- Prescriptive Analytics
- Diagnostic Analytics
- Cognitive Analytics
Descriptive Analytics
Descriptive Analytics is about making a decision on the basis of historical data. The best example of Descriptive Analytics is ROI Return-on-Investment. Data aggregation and Data mining are two very crucial steps in Descriptive Analytics. Data Aggregation refers to collecting data about a problem and then storing it in a format that can be easy to access for Data Analysts. Data mining refers to the searching of collected data to find patterns and meaning in it.
Descriptive Analytics tells about the gap in strategies and points to the most powerful areas of a business strategy. Descriptive Analytics is also important to make future strategies on the basis of historical data. Descriptive Analytics becomes the base for the other Analytics strategy to work on.
Predictive Analytics
Predictive Analytics is about forecasting future business scenarios like estimated sales for next year on the basis of Machine learning and Data. Descriptive Analytics becomes a solid ground for Predictive Analytics. Techniques such as Neural Network, Regression, Decision Trees become useful for building a Predictive Analytical Model. It predicts the possible scenarios of a business model in future.
Predictive Analytics become really useful in scenarios like drawing a new investor for a startup. An Investor is interested in past performance as well as the future performance of a company. He cannot invest his money on the basis of past performance only and needs to see where the company might reach in the near future. So that he can earn a big profit.
Another use case of Predictive Analytics is forecasting the amount of raw material required, seeing the rise in demand for a good.
Prescriptive Analytics
Prescriptive Analytics is a much more detailed practice that takes decision even on the granular level. Predictive Learning becomes the base for Prescriptive Learning. An insightful forecast from Predictive Analytics is done by the specific model using more complex algorithms to achieve machine learning-based decision-making.
Predictive Analytics can do the forecast of the required investment for a startup, but Prescriptive Analytics can define the rise in business what they might need more. However, such a model comes with a high risk and high reward strategy. On the basis of the past decision made, Prescriptive Analytics can decide what decision must be taken to in order to achieve the goal. Still, there is always a high margin of error involved because of the changing conditions and Human behaviour involved.
Diagnostic Analytics
Diagnostic Analysis as the name suggests is about diagnosing the conditions involved. Descriptive Analytics tell the outcome of any decision, while Diagnostic Analysis is about finding the reason for that outcome. It is important to find the reason because only then we can be sure if these same conditions repeat in future, we can take the same decision or not. Diagnostic Analysis is applied in both the scenarios, GOOD or BAD.
Diagnostic Analysis involves Identifying the anomalies in the data, collecting the data that is related to the anomalies, Use statistics to discover trends or relationship that explain these anomalies.
Cognitive Analytics
Cognitive Analytics is more like a self-learning loop. A decision is taken on the basis of findings and pattern. That decision is then monitored to observe the changes in the current situation, then these findings are also included in the previous data for future decision-making. It is like replacing a call centre with a machine learning and NLP model, which was trained already on the call logs of the call centre employees. Now, this model is capable of solving 90 per cent of the daily queries and also this model is capable of improving itself with time.
Data Analysts Responsibilities/Data Analysis Process
We will discuss the responsibilities of a Data Analyst. This is a critical role from a business point of view, as it is the duty of the Data Analyst to uncover and make easeful conclusions from the available information. Data Analyst needs to keep the company updated on a daily basis and must focus on the aspects which might be hidden to the normal eyes. If a Data Analyst misses his responsibility, then the progress of the company might get affected.
The main areas for the Data Analysis Process are.
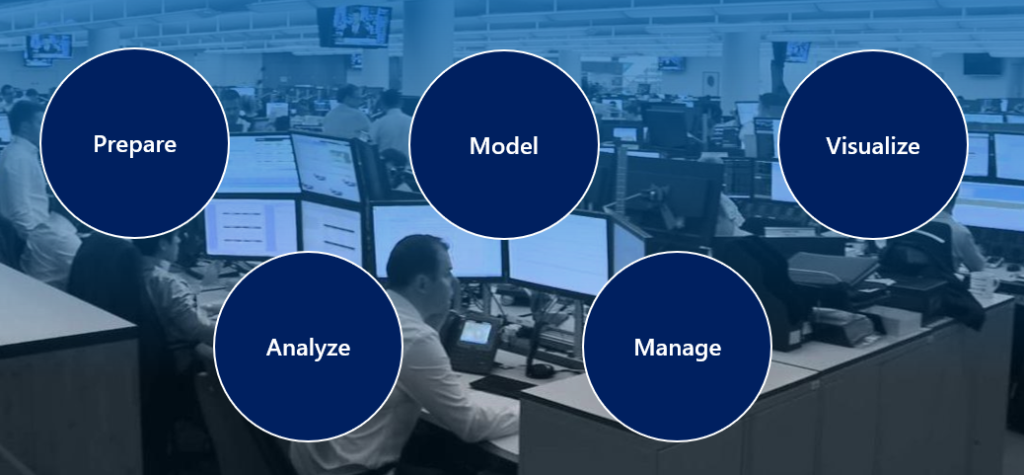
Prepare Data
As a Data Analyst, this is one of the steps where most of the time is spent. Data that is not compatible with the problem or Data that is less in amount can lead to a biased model or bad model, which is of no use as per companies perspective. To make a better model, the right kind of data in large amount is preferred. A wrong model or a biased model may lead to wrong decision-making, which might further lead to the loss of revenue for the business.
Data Preparation is the process of data profiling, data cleaning and data transforming to get your data ready for model and visualization. Data preparation is the process of collecting raw data on the basis of a business problem and then turning that data into an understandable and trustable form. Make sure the right data is collected as per problem, ensure that the data is not highly biased, and the sample size is big enough, then removing the incorrect or unuseful data from the dataset, identifying the missing values and finding a solution for them, converting the data into a model readable form or converting it from one form to another, normalizing the data and many other steps.
The most important factor is to ensure that the data collected and being treated will surely meet the expectations and requirements of the problem because if it doesn’t then you have to repeat this process with no alternative.
Privacy and Security of the data are also important. Make sure that the data collected does not fall into the hands of anyone who is not involved in this process. This can be done by anonymizing the data and avoid oversharing of the data to prevent any information leak.
In the Data Analysis workflow, Data preparation is the most important and lengthy step. It can take anywhere between 15% to 40% of the total time. Data Analysts uses several iterable steps to minimize the poor quality of data and turn it into more valuable insights.
Model Data
When your data is ready to use, then the next step is modelling. Data modelling is about connecting all the available data with the help of relationships. Custom calculations are often added to extract more knowledge from the data.
A good model helps to make a report better by improving the insights of the data. An effective model makes reports more accurate and also faster to use. As in most cases, all the data that is available cannot be used to make a model because that will make the model too bulky. A bulky model is slow in operation and isn’t preferred. The making of a model directly affects the quality of the report and Data Analysis as well. A well-designed model with well-prepared data will be properly efficient and enhance the accuracy of the report. While a poor model can have a negative impact on the general accuracy of the report.
If your report is slow, then you might need to prepare the data again to remodel it. The process of Data preparation and modelling is iterative. You cannot expect the best outcomes on the first attempt.
Visualize Data
Describing visualization in one line is “Charts should speak for itself”.
The simple yet strong idea of visualization is that the dashboard should tell the story on its own. That means, create the report/dashboard in such a way that it should be telling a story about the data by itself. When your charts are simple and easy to understand, then it makes the decision-making easier. The charts that are represented should be made in such a way that a person that does not have proper knowledge of your business must be able to understand the data and your business outcomes (but that does not mean to share your charts with the outsider and break company policy).
As a Data Analyst, Data Visualization is your responsibility to understand the problem that the company is trying to solve. Make a large collection of data so that the model is not biased, but all of this data cannot be used in the report. So filter the data and make it better and smaller to observe the insights easily and quickly. Data Analysts should also keep important data points in mind so that all the aspects of the problem can be solved with the least data possible in the model.
Use a different colour scheme while Data Visualizing so that the picture you are trying to present does not appear vague because of the colour confusion. A mix of different colours is good while making a report and makes the picture clearer and easy to understand. Reports should also be made in such a way that they can be modified when needed to and do not have to make the same report again when needs to add a tiny feature.
Built-in AI features of Power BI can also be used to gain insights into the data without writing any code.
Analyze Data
The understanding and interpreting of the information is the most crucial task and Data Analyst. A Data Analyst should understand the problem, should have insights about the data, identify patterns in the data, predict the possible outcomes and easily communicate those insights to everyone who is related to that business. With Data Analytics, organizations should be able to take better decision about the business problems. Organizations should be able to drill into the data and predict future trends and patterns. These trends and patterns can help organizations to make better strategies to tackle problem if any.
Previously, Data Analysis was a tedious process and required Data Engineers and Data Scientists, but currently, tools like Power BI has made it easier to analyze the data. Power BI AI also plays an important role in analyzing the data. You can also use Azure Machine Learning and Azure Cognitive Services.
Manage Data
Data Analysts are responsible for managing important components like reports, dashboards, datasets, workspaces. The Data Analyst is also responsible for the security feature of the datasets and workspaces. Managing the projects also included sharing and collaborating with different individuals in the team. The team members should be able to fetch information when they need to. Data Analyst has to make sure only the right people have the access to data.
Power BI helps you manage the data security and access control so that your data does not fall into the wrong hands.
1 thought on “Data Analysis: Overview, Roles and Responsibilities”